
Ranter
Join devRant
Do all the things like
++ or -- rants, post your own rants, comment on others' rants and build your customized dev avatar
Sign Up
Pipeless API

From the creators of devRant, Pipeless lets you power real-time personalized recommendations and activity feeds using a simple API
Learn More
Comments
-
 buitrung2957yWhat you want is the histogram of people count/hour. There's plenty of libraries to help you out, e.g. python's matplotlib.
 -
Calculate an average for each hour (or other time period) and plot them using some library. Consider also calculating median value instead.
-
 620hun80977y@mrrmc
1, Google only knows about Google users
2, Google only knows how many people are in the sports centre, but I only care about the gym area
The sports centre does provide current figures, but I have to do the trend analysis myself. -
Before I learned Matplotlib, etc., I used to make bar plots using _'s. Like this:

-
buitrung2957y@fizzbuzzCoder libs are for our utilization, no doubt the result is nice and clean. But doing something retro like your work (which reminds me of htop, mpd, etc) is a proof of a classic progammer! 😁


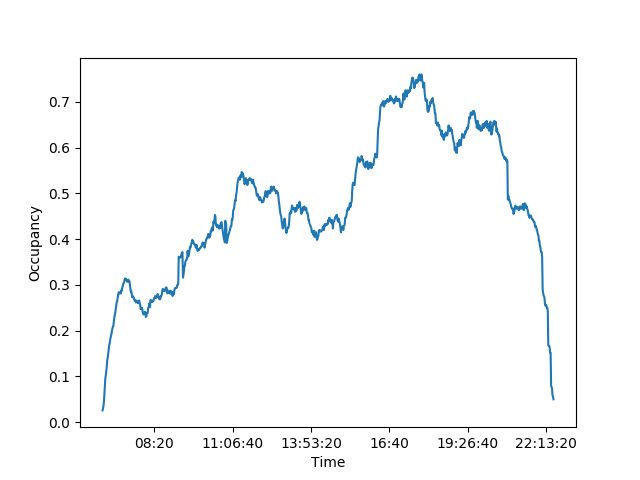


Data scientists: I have logged how busy my gym was for a week (every minute). How would I generate a graph of a typical day? I haven’t done anything like this, so I don’t know how to approach the problem. Basically I want to see what time of the day there’s a quiet period on average.
question