
Ranter
Join devRant
Do all the things like
++ or -- rants, post your own rants, comment on others' rants and build your customized dev avatar
Sign Up
Pipeless API

From the creators of devRant, Pipeless lets you power real-time personalized recommendations and activity feeds using a simple API
Learn More
Comments
-
With matlab you just need the mindset that nothing works like you think it does. Then you'll do fine.
-
 endor54476y@sweetnothings they are discrete. Both x and y are discrete 1D arrays, and Z is a 2D matrix.
Hence my confusion when it decides to use the x axis to access columns and y axis to access rows, instead of the other way around (as I'd expect from the Z(x, y) notation). -
endor54476y@sweetnothings look at element a(3,4) of the matrix: the reported position is (x=4, y=3)
-
endor54476y@sweetnothings you mean like this?
I can see why you would represent things that way in your example, but what you've essentially described is a left-handed coordinate system.
Sure, it's mathematically coherent, but it seems like a weird 'default' choice to represent an arbitrary set of data, given that most [citation needed] people work with right-handed coordinate systems.
Or at least, in my field of study (aerospace engineering), the most common assumption I see is that we're working with a RH coordinate system.
Given that assumption, using a LH system for a surface plot seems a very odd design choice to me - even for a more 'mathematically inclined' tool like Matlab (referring to stuff like array indices starting from 1 rather than 0).
But maybe I'm assuming wrong? Are LH systems far more common when representing data like this? Or am I misreading your axes?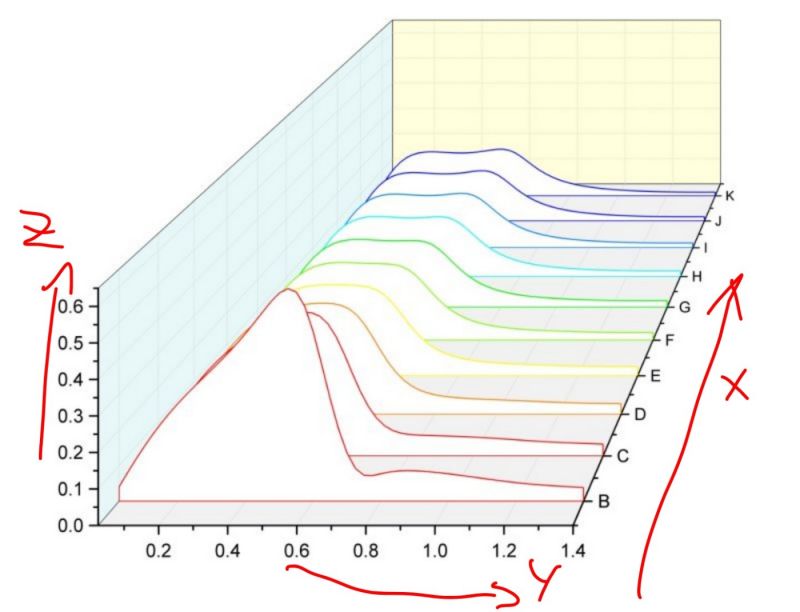
-
endor54476y@sweetnothings lol, that excel plot is actually right-handed if you look at the data. Even if you transpose the matrix, it's still readable.
In my example, matlab swapped the axes but pretended like it didn't. So a(x=3, y=4) gets labeled a(x=4, y=3) in the plot.
So it didn't just flip the axes around, it actually swapped data between x and y. That's inconsistent.
You can see that if you try to look at element (1,32), which is in position (32, 1) in the plot - it's not respecting the axes that I've given it.


Thank you Matlab, for my daily dose of frustration.
Thank you Matlab, for deciding to surface-plot a 2D variable with the x axis = columns and y axis = rows, because of course that's the most intuitive way to go about it.
Because of course that's consistent with the standard way to refer to a variable's elements.
After all, everybody knows that Z(i, j) refers to the i-th column and j-th row of a matrix, right?
Thank you, Matlab, for depriving me of the little fuck I gave about getting something done today.
Now go die in a fire.
rant
matlab must die
i hate you more than facebook