Ranter
Join devRant
Do all the things like
++ or -- rants, post your own rants, comment on others' rants and build your customized dev avatar
Sign Up
Pipeless API

From the creators of devRant, Pipeless lets you power real-time personalized recommendations and activity feeds using a simple API
Learn More
Comments
-
 nekokatt805ythat feels like pycharm without the cython debugger extension most of the time for me
 -
@nekokatt Why does that happen in pyCharm? Where does it get that runtime from? I am confident I have killed the process multiple times as I spin up a webserver on the same port - if I didn't I'd get a (bind failed address already in use).
-
 nekokatt805y@netikras the debugger by default is pure python in pycharm, meaning there is a trace hook that is a pure python function that gets invoked for each line of code that runs. Because I was debugging a code base that was doing a large number of bulk operations and due to the nature of it, it was noticibly slow.
Cython is a superset of Python that is transpiled to C, so you have lower level hooks that make it go faster.
In Java, setting breakpoints on method declarations seems to slow the debugger down massively for me when using a remote debugger; maybe that is your issue? Only using breakpoints on lines of logic/lambdas and not method definitions themselves didnt ever seem to have the same issue. I assume it is just how the JVM intercepts those calls. -
The one thing I'll give Microsoft's debug strategy, is they have the ability to detect and display when a symbol will not be hit. Seems relevant in this situation.
-
@Root
No, they just use symbol debug files and shims to detect when something isn't loaded and indicate that on a breakpoint expecting it to be. -
@SortOfTested I don't see how a symbol not being hit is related to a debugging session not only surviving several application [that is being debugged] restarts, but also preserving state, i.e. it keeps continuing the transaction's flow
-
12. console.log("App has started");
13. console.log("main got called");
14. console.log(some_randomass_object);
...
Then later a dev (maybe even you) looks at your code and is like why the fuck did I put so many ridiculous console.log statements in and then never clean them up... LOL
Related Rants

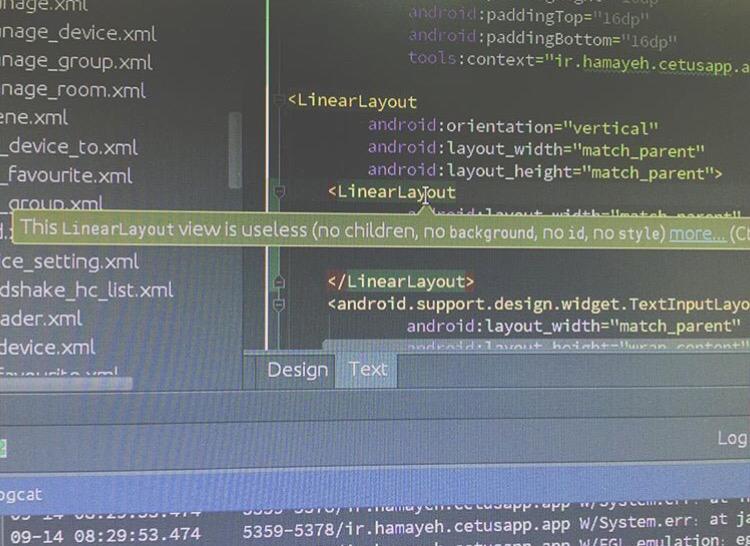
 The saddest error message I've ever seen. Poor LinearLayout 🙁
 Jetbrains IDEs be like
1. attach a debugger
2. create a set of breakpoints
3. perform an action in the UI
4. breakpoint is hit. F9 to jump to another breakpoint
5.
...
.......
...........
................
....................
nothing............
even more of nothing.....
......................................................
6. Kill the app. Restart. Repeat. Nothing again. Repeat it all ~5 times. Give up.
7. Go get some tea.
8. Come back with a cup of hot tea
9. the _next_ breakpoint is now hit (º . º)
10. F9 - yet another breakpoint is hit.
11. contemplate your own mental state, considering the #6
rant
intellij
phantom runtime
magic
debugging nothing