

Join devRant
Do all the things like
++ or -- rants, post your own rants, comment on others' rants and build your customized dev avatar
Sign Up
Pipeless API

From the creators of devRant, Pipeless lets you power real-time personalized recommendations and activity feeds using a simple API
Learn More


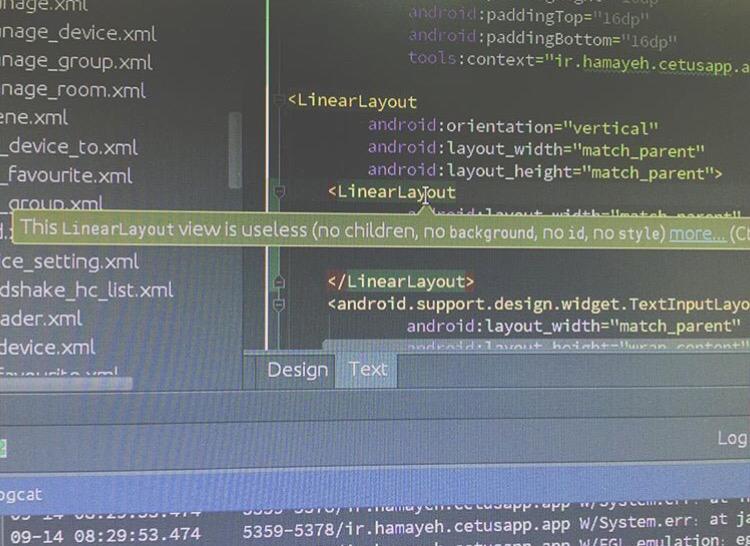 The saddest error message I've ever seen. Poor LinearLayout 🙁
 Jetbrains IDEs be like
1. attach a debugger
2. create a set of breakpoints
3. perform an action in the UI
4. breakpoint is hit. F9 to jump to another breakpoint
5.
...
.......
...........
................
....................
nothing............
even more of nothing.....
......................................................
6. Kill the app. Restart. Repeat. Nothing again. Repeat it all ~5 times. Give up.
7. Go get some tea.
8. Come back with a cup of hot tea
9. the _next_ breakpoint is now hit (º . º)
10. F9 - yet another breakpoint is hit.
11. contemplate your own mental state, considering the #6
rant
intellij
phantom runtime
magic
debugging nothing