

Join devRant
Do all the things like
++ or -- rants, post your own rants, comment on others' rants and build your customized dev avatar
Sign Up
Pipeless API

From the creators of devRant, Pipeless lets you power real-time personalized recommendations and activity feeds using a simple API
Learn More


 When there are only 2 pages on Google you know you're in serious shit.

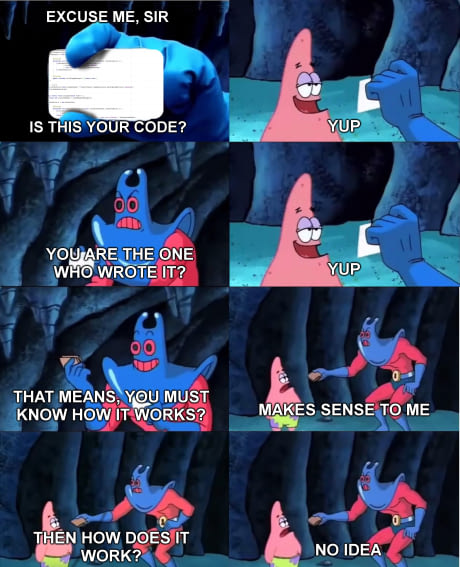 When you talk to other devs about what their code did. I also relate myself to this.
I never knew that debug symbols, a core dump and gdb would be so powerful to debug
The command line is peak ol' reliable
random
debugging
gdb
segmentation fault