

Join devRant
Do all the things like
++ or -- rants, post your own rants, comment on others' rants and build your customized dev avatar
Sign Up
Pipeless API

From the creators of devRant, Pipeless lets you power real-time personalized recommendations and activity feeds using a simple API
Learn More


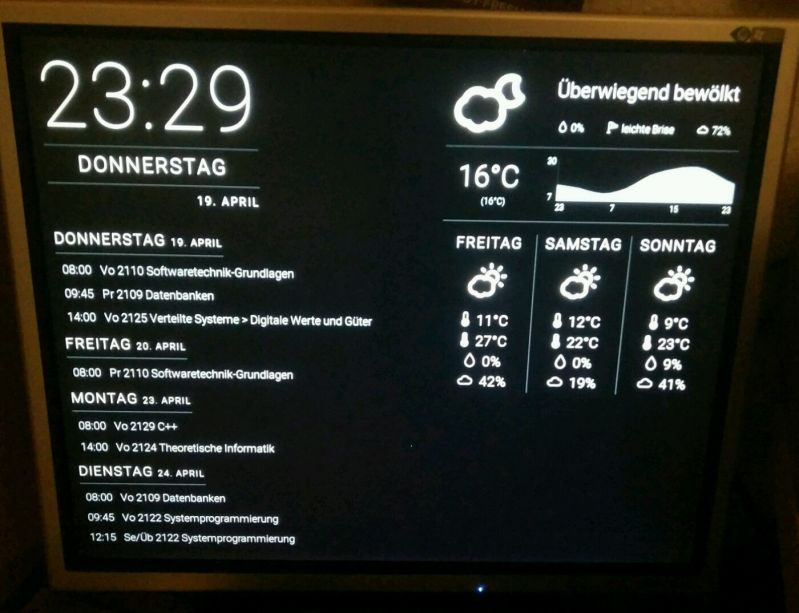 I've made a thing and I'm proud of it.:D
 This is how cables are meant to be! 😍
How do you guys monitor programs on your servers?
For example, I have a raspberry pi zero w running raspbian (headless). On this pi, I have a bunch of discord bots and web scrapers running at the same time. My solution was to run them all from a bash file:
Python3 discordbot1.py &
Python3 discordbot2.py &
Python3 webscraper1.py &
Node webscraper2.js & etc.
Is there a better way I could be running these services? How is stuff like this usually done?
question
raspberry
multiple programs
servers