

Join devRant
Do all the things like
++ or -- rants, post your own rants, comment on others' rants and build your customized dev avatar
Sign Up
Pipeless API

From the creators of devRant, Pipeless lets you power real-time personalized recommendations and activity feeds using a simple API
Learn More

Related Rants

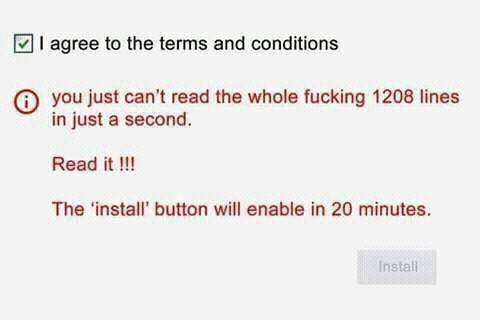 The honest website ever... 🙌🏻🙌🏻🙌🏻
 Reality
Hi, guys, about a month ago i created a covid 19 live tracking website for my portfolio. But today remember i could ask for review in devRant about the site. So i hope you give me any upgrade suggestion for the website.Anything like ui/ux or new content or faults etc
website link :
https://covid19trackermj.herokuapp.com/...
rant
portfolio
project
review
suggestion
website