
Join devRant
Do all the things like
++ or -- rants, post your own rants, comment on others' rants and build your customized dev avatar
Sign Up
Pipeless API

From the creators of devRant, Pipeless lets you power real-time personalized recommendations and activity feeds using a simple API
Learn More
-
We have a lot of monitoring screens on walls at my work... Some of them show charts... The one showing the last two months of mailbox database growth has started taking an odd shape.
 16
16 -
Early in my career I was assigned the task of implementing a 3D pie chart into our application that you could spin and rotate with your mouse. You know, because sometimes you want to see the sides and the back of a pie chart.4
-
When Hacker News commenters say "I could build that app in a weekend!" I think of this chart of how Slack decides to send a notification - Matt Haughey
Asides; Can one really build an app in a weekend? 14
14 -
I know pretty much everyone here understands the importance of net neutrality, but here’s a nice chart you can share with all your non tech friends explaining the importance of it in terms they understand
 24
24 -
If Big O notations where emojis. This chart shows you common big-Os with emoji showing how they'll make you feel as your data scales. Source blog.honeybadger.io
 7
7 -
Rage..
Boss: 'I've got a PowerPoint presentation with 45 charts in it. Oh, and a huge excel sheet with the data for it. Please build some of the charts in our own software, with the given data.'
Easy, I thought.
Yea, thanks to the person that gave my boss the data.. The half of the important columns were removed (privacy stuff).
And.. Excel? Oh, and his calculations are nowhere documented nor consistent.
I converted excel to postgres, easy.
It took me 2 hours to fkn research what he calculated in one line chart, just to implement it in like 10 minutes.
2 hours, man I could made awesome stuff in that time!
I guess I should write this in CAPSLOCK to make it more interesting. I'm just raging in my head 😂1 -
Every day in the office kitchen I find bottles of milk open and left out, in the fridge with no date, and empties everywhere. Yesterday I found 11 open and partially used bottles of milk. I’ve designed this flow chart to help educate people (in a way developers can understand) on how to manage milk which is apparently a real challenge for some.
 10
10 -
Manager: I don’t care if it has bugs, if we don’t ship it this Friday I’ll have to redraw my Gantt chart AND I’M RUNNING LOW ON CRAYONS!!!9
-
Why in the name of Donald Knuth did you think it was a good idea to have a 1500 line Java Method? What THE HELL WERE YOU SMOKING THE ENTIRE FILE IS OVER 3000 LINES AND HALF OF THEM ARE COMMENTED OUT!
Don't even get me started on your "unit tests" which is a massive 5000 line behemoth that randomly has massive swaths of code commented out.
And of course no solution like this would be complete with you HARD CODING EVERY F****INIG STRING IN EVERY TIME!
And it's not like you don't know how to use classes as you have several of them, every single one of which is over 500+ lines and consists of only getters and setters. LET ME INTRODUCE YOU TO A MAP! REALLY WHY WOULD YOU USE 500 LINES FOR A CLASS THAT IS JUST GETTERS AND SETTERS?!
The part that really burns me about all of this though, isn't the fact that you sent it to me when I was running into a similar issue, and said "check this out it should help", what bothers me most isn't the indescribable rage I felt looking at your code, the part that really really really bothers me is that you are a veteran with over 15 years in Java development, and according to the org chart are a lead senior engineer getting paid substantially more than me, whereas I am considered a lowly mid-level developer, who isn't worth promoting to your level.
On the plus side you are now going to be featured on theDailyWTF so congrats on the notoriety.8 -
I put this chart on my desk since my boss thinks every little thing requires my immediate and undivided attention. It comprises of a few of his favourite words in a vague order. Watching him try to choose the most potent word to describe the most recent whim of general staff is worth a few chuckles.
 2
2 -
Admin work, because its all manual:
- Each new project has to fill out an Excel tab in a workbook, with a list of all the major tasks and who is responsible. This then needs to be used to create a Gantt chart, manually, in the same tab, showing in what month a task starts and ends.
- Every month we have to manually enter status updates into a powerpoint slide on a shared deck. Which has a collision at least once per month.
- Once a quarter we need to do something similar as the powerpoint slides, but into a word doc instead.
- Once a week we need to track our time on projects in a tool that can't be integrated with (no API or anything). Meaning we can't link up a ticket tracking system to it, so again, all manual.
- Once every 6 months a new round of research funding opens up and we write proposals. The status for which are tracked in another Excel spreadsheet, manually, once a week until the deadline.
- The instructions for what to do with the proposals are so vague and badly documented that there is an unwritten rule, that for the first time you will have to ask a bunch of questions to the project manager. This is accepted by everyone and its just the done thing.
- Everything is stored in a dropbox style system, which has become so cluttered I can only find resources by saving the links sent out previously.
- Some of these updates / reports also get a 1 hour meeting for everyone to stand up and read out what they've entered.
- From time to time random things will need to be reported on to the higher ups (how many publications, research papers, patents, times and dates etc.). Again rather than a tool, a new Excel spreadsheet is whipped up and emailed to everyone on the team. Whoever sent it out, then has to merge the 20+ copies into 1 doc.
- Some of the staff (mostly the devs), use a ticket tracking system to keep track of everything. Management refuse to use it to track the things they need. Instead we have to copy paste from it into the word docs, powerpoint, excel etc.
- By far the most annoying. Management force all the above as they need the info for finance, accounting, legal etc etc. So we have to do it, but whenever there is a question from legal, management send the question to us. So despite having documented every facet of everything imaginable, it all gets ignored in favour of endless emails.
I once tried to to put an end to all of this madness by proposing the use of a ticket tracking system, and then building reporting tools on top of it.
... I was told that it "wasn't appropriate". Still don't know what that means.9 -
1. Scripting out a team. I've built a collection of bash scripts to do what one of our teams does. Except the script does it in 30min and always does it well where that team used to take 4 to 10 hours and almost always missed something in the way.
2. Automate 70-80% of our BAU tasks with a single >4k loc bash script. Integrations with servicenow, lots of internal portals, predefined huge sets of commands to run on separate servers or lists of servers, do all sorts of diagnostics, schedule hw maintenance for DC folks, chase for approvals, track CHNG/CTSK tickets in a graphical chart so we would not miss any of them and lots lots more.
Finally we were able to afford time to make some coffee/tea.
These are the bau optimizations I'm proud of the most. And they have made significant impact on how our teams operate.
Whoever recognizes both company values in the tags and know what is that company - are they still using ´S´ in unix team? :)1 -
2018 was a dumpster fuck for me. I was looking for 2019.
Oh boy, I was wrong.
I had a flight booked for 3rd Jan. I was supposed to go to Delhi, back to my job.
On 2nd Jan evening, I got a high fever. 103 F and my heartbeat were around 140. My brother took me to Hospital and after the doctor checked me.
There were no other symptoms. Only high fever. The doctor told me to do some blood test and give me a dose of Antibiotic.
Next day all the result came back negative. Doctor give me 3 days of antibiotic course and told eat light.
After 3 days of getting the 4g antibiotic in my body, Nothing changed. The fever was there and no symptoms.
on the 3rd day, the doctor increases the course to 2 days and told me to get more blood test. I also had to get 4D sonography and Heart ECG and its sonography.
on the 5th day, nothing changed. I still had a high fever. All the blood test were negative.
On the 6th day, I was admitted to the hospital and my medicine was changed to high does of broad-spectrum antibiotics and lots of new blood test.
There were taking blood from one hand and giving antibiotics to another.
After the broad-spectrum antibiotics, my fever went down to normal but all the 17 blood test I did came completely negative.
On the 8th day, we went to an infection specialist. He checked all the report and ask us to do a very details sonography. After all those things he said it most likely staphylococcus infection.
So here I am, making a chart of my temperature every 2 hours and taking two tablets every day.
This last 10 was very hard. There was a point where I was thinking "this is it. I am gonna die".
I am still waiting for a very detailed blood report which takes 5 days to create. I will get it after 2 days.
So after lots of medicine and over 15+ reports, Here I am working from home.
What a wonderful start of 2019.8 -
My TEN YEAR OLD twin girls came to me with a TIMESHEET and PIE CHARTS to explain to me why "Our household would benefiter (sic) a Nintendo Switch".
They... actually did what for an intern would be a passable data storytelling job (orthographic errors aside).
They explained how they would share the videogame between themselves (because it is not allowed at their school, not that we would let them bring it there anyway) in a colorful timesheet spanning four days a week.
They even put a pie chart showing how most of the time nobody will be using it.
I feel at the same time immensely proud, scared, and a wee bit freaked out that they came with all that to me but with their mother they just talked. Do I seem so distant that they feel they can't convince me without data? I gotta watch out for using work jargon at home.
Anyway, first "interns" that I have ever seen using a pie chart with the appropriate number of classes (even if highly biased).9 -
Trying to write more commit , so that i can stay top in github project chart with less real code be like....
Git commit -am "added p in code"
Git commit -am "added r in code"
Git commit -am " added i in code"
Git commit -am "added n in code"
Gir commit -am "added t in code"
Git commit -am " gave the proper indentation to print"6 -
No, I do not wish to work on your Scrum-managed project.
I do not wish to contribute to the Taylorism of my profession.
I do not wish to be an interchangeable cog in your software sausage machine.
I do not wish to be tracked by some pointless metrics like a call-centre worker.
I do not wish to bust my tight, cute ass to sprint after some idiotic management request that could have been factored in earlier.
I do not wish to obtain some piss-ant qualification that "authorises" me to do my job.
I do not wish to be party to your lie that technical debt will be avoided by refactoring---whatever the cost.
I do not wish to contribute to the death of software engineering to have it replaced by software development.
Agile? Sure. I can pick up the phone and talk to the client, users and fellow devs. After all, that's what it FUCKING MEANS. Communi-fucking-cation.
See that burndown chart? See your anus? Know what's happening next?
Fuck Scrum and every fucking bottom-feeder that is scamming a living by promoting it. You're killing this business.
Hugs and kisses,
Platypus15 -
I've been working on implementing a fairly large feature on a project at work--
**Sorry. I should rephrase that**
I've been *trying* to work on implementing a fairly large feature on a project at work.
It's slightly complicated because I'm not as "in the know" with the project as I should be. I get tossed around projects a lot as the only designer+developer so I've got my hands in a lot of buckets... Or git repos I should say... My source tree has a lot of tabs open and each project is run by someone with their own ideologies on how stuff should be done and laid out and what not. Basically jumping between these projects leaves you mildly capable on all of them but not amazing at any of individual one them--
--I digress.
There's a bug I've been trying to fix.
--Stupid simple bug, literally just a casting issue or something but there's so much data in this one object that it's taking a few solid minutes of concentration to figure out which variable is busting it all up. It shouldn't take long to fix...
But it has. It has taken 4 days.
FOUR. DAYS.
...To fix what is basically a null reference exception.
Every time I sit down to work on this bug real quick I get pulled away to do a wireframe or change a flow chart or diagram or colour or print styling.
Every. God. Damn. Time.
4 days. Soon to be 5.
My commits are real low at this point guys.
Please boss man, just let me code...4 -
Put away the keyboard. Think about what you're going to do, chart it out, work through the logic and then, when the entire construct is before you, you start typing.
Yes it will take longer, you're a junior, enjoy that nobody expects you to do miracles (yet) and take the time, you'll get it back when you're so used to working through logical problems that it happens on its own as soon as you hear about the problem.
Cutting corners and "hacking a quick solution" without fucking over the entire system is an art form. Before you do art learn your damn craft.3 -
Time to rant about JavaScript tutorials.
If you don't know the 'jQuery basic arithmetic' joke, Google it now. It'll make you laugh, promised.
In that manner i just remembered a JavaScript tutorial my fiancee tried to follow when she did an internship at the company i work for last year.
She was tasked to create a temperature interface for our server rack, which she wanted to do via an Arduino and a webserver aswell as an SQL database.
The Arduino part wasn't really a problem, but since she had no experience with js she very closely clinged to a chart visualisation tutorial.
All of that worked very well, but beeing the person i am i looked at the code and found something off.
The chart library had no dependencies to external libraries or any local files for any of them. Though the tutorial used a jQuery import.
So why did it use jQuery?
Well...
To load the chart initialization after the page has loaded.
So they pulled the entirety of jQuery in just to do what fucking window.addEventListener('DOMContentLoaded',function(){...}); could have done.
I wonder how many people who just want something to work did this shit. I hate it that so many tutorials do not adhere any kinds of standards, override behavior because they don't like it, even though it may have a very good reason to exist, pull entire libraries in for something vanilla <language> can do in 3 lines, etc.
Fuck.6 -
I asked a junior dev to convert y axis value to dollars and render the same on a chart. This is what he does.
 8
8 -
Was in a meeting(been quite a lot actually) with a lot of people that hold "director" in their title. As per our institution's salaries and ranking description, they do not "outrank" me. Our titles are just different, but they are there with me.
It surprises them quite a bit when they try to have some hold in the direction of my department just for me to tell them that they do not really get to tell me what to do or how to do things after I show them said chart. It surprises them a bit more when they find out what I am saying is completely true.
I don't appreciate people trying to manhandle my employees.
The conversations that follow are quite interesting as I am quite vocal in our interactions.7 -
I see posts about automating your work flow, but if your aim is to save time by automation consult this handy chart
 4
4 -
I asked my boss for a raise. Since we're data scientists, I basically plotted a column chart showing that he was paying me half of the european average. I said I was willing to negotiate but he was very 'discomfortable'.
Time to go find another job. Or second one 😭6 -
Client asks me to implement pie chart on webpage. Sum of figures supplied amounts to > 100%. Pointing out discrepancy I request the correct figures, only to be told that the figures are correct. Very well. One week passes. Receive email from client: "The figures for this chart are wrong, they total > 100%, here are the correct figures...". *Sigh*.1
-
a small local social network i made around 2008 as a replacement for the original which the owner closed down.
i missed the people from there, so it motivated me to make a replacement in a week, while learning html+php+mysql+js.
it worked for about 3 years and i redid it from scratch 3 times as i gradually learned more.
it was cool to be basically a host of a community i've come to like in the years before, and it was basically the only project i felt, really felt, had meaning, a point. people were grateful that i made a replacement for the original closed-down site, and i was grateful that they were using it and that i could keep talking to all of them on it.
at the height of its popularity it had about 1500 registered accounts, 150 daily logged in ones, and about 30-40 very active ones.
it was also the place where i went to implement all the cool stuff i learned and came up with.
it had a pretty cool questionnaire creator (originally just a test of how deppressed users are, but then i thought "why not let people make their own tests/questionnaires?"), which tracked people's results over time and showed them on a cool interactive flash-based chart.
also a whole forum system made from scratch, wysiwyg article editor, later seamlessly integrated admin controls for those who had privileges, like, not a separate admin ui, but the admin buttons right on the site, later even a realtime chat persistent across page reloads where you could put special links which, on click, would highlight site elements/buttons, or even complete step-by-step path to them if it was more clicks. would highlight the first step, after clicking would then highlight the second one, and so on...
it was pretty cool stuff for 2008, and afaik it basically landed me my first two full-time jobs with almost no actual job interview, basically just "we looked at the site, interesting stuff, tell us how you did x and y and z on it, okay, hired"
back then i kinda felt i have a bright future ahead of me =D1 -
So guys, for those of you that know what a burn down chart is, this is my teams, aka Front-end ONLY for end of March.
 7
7 -
TLDR; Go to bottom of post.
Around this time two years ago was the start of my group project in University. The project was to write an app in android and have a web side to it too. The group was to be overseen by a member of staff. The first meeting was introductions and to look at the spec, during the second we were to decide a group leader (PM) and other positions.
A person I shall call BD and I volunteered for PM. I didn't have experience with leadership but wanted some, and was the only one with confidence in android, the biggest part of the system. I got four of the votes.
BD, with his scouts experience, not being afraid to breathe down people's necks and bash some heads together, and having been PM last year, with his group receiving 69% (he failed the year and was resitting), earned 5. One guy was missing.
When it came to sorting out roles and responsibilities, BD confessed to not being a strong coder but that he'd help here and there. His role was planning our deadlines, doing our Gantt chart for deliverables, and was supposed to write a really detailed spec. He didn't have it at the meeting of the next week, as it was still in the works, and never messaged anyone. Next week he turned up with a Gantt chart of 1A4 page that only included the deadlines and deliverables in the spec, with three colours. One for android team, one for DB guy, and one for web team.
The guy who didn't turn up for voting got a girlfriend, a job at mcdonalds and did barely a thing. One guy in the web team did everything, carrying his friend who wouldn't do work (and also got swept out to see in a rubber boat with one of his bros lol (he was rescued)), and even though I'd done android dev I wasn't as quick a learner as two others in the team. Out of 10 people, 6 did real work.
The web guys stopped coming to meetings as they were taken over by android talk, and as we were quite behind, BG tried yellow carding them. They turned around with the website pretty much done, this one guy doing more than the 4 of us on android had. Yellow card lifted. We'd already complained about BD and his lack of everything (except screen brightness as he sat at the front of the lecture theatres with his wide brimmed hat looking at 9gag and videos (remembering he said he was resitting that year)) but grew a stronger dislike. Found out that he spent most of his time with his gf at our secretary/fellow android dev's house. Come coding week, he disappears entirely, only to attend meetings. He gave us a shell of the android code used for his previous year's project (along with documentation, complete with names and dates of updates, most of them (including the planning ones BD was supposed to do) bearing either one of two names. It was behind where we were at the time and had a lot of differences to our spec, and if we had used it BD may have used that to pull us down with him if things went wrong. He resurfaced at the end with the final documentation of how we'd all done, including reports on how each member had performed, which we were supposed to have reviewed. Our main, most proficient dev he accused of being irritable and brash, and a bad communicator. He was Norwegian, his voice was just a bit gruff, and he was driven and didn't waste time. He bashed the web team for not turning up, and had already been rude and unhelpful to everyone who voted for him in the first place.
In our own reports we all devoted paragraphs to delicately describing his contributions, excluding his suggestion that we use the code he gave us. Before we had our results and our work was completed, he individually kicked us from our group's facebook group and unfriended us.
Our 43% mark at the end, coupled with his -40% penalty from the red card we had him on, felt good, but not as good as a better result would have, especially as the fool that was BD would be inflicted on a group a third time. He changed to some other course after that year finished, so he must have failed his resit of second year.
During third year, a friend of mine who was PM for a group that passed well passed other things with too slim a margin to be happy, so chose to resit the year. He didn't have to do the group project again, and had that time free. But BD had to resit. His group had 69%. A yellow card with a 20% deduction wouldn't do it, so he MUST have had a red card as PM his previous year. Well that didn't come up when he claimed credit for his team's 69% during elections... My housemate's compsci boyfriend 2 years up overheard me talking about him, he was in 1st year with BD. BD failed and resat 1st year too. 4 years and he couldn't make anything stick. I feel bad for him through understanding the pains lack of work and internet distraction bring, and unfortunately I can't wish bad things on him because he brings them on himself. I wish I never see his face again though.
TLDR; Guy in group project lies and is dishonest from start to finish, getting PM pos by 1 vote. Gets what he earns.2 -
Am I the only one who doesn't judge a programmers contributions by commits or change history?
Frequently I'm always near the bottom of contributors, because I don't make a million commits when it's broken. And I don't commit lines that will likely disappear in later commits. I like to finish a function, test it, check it, rework, and then make a "made function()" commit, as apposed to:
"Wrote function()"
"Wrote unit tests for function()"
"Fixed error"
"Code cleanup"
"Style guide compliance"
"Reworked function()"
etc.
Sorry that I keep my commit history clean and ensure it builds.7 -
heard about bitcoin a few years ago. wanted to buy. to lazy finding out where to buy. didn't buy. 3 years later looking at chart. OMFG fuck. Sad life.2
-
I was working on a team with people with various employment statuses. Contractors, employees of the client, and me as a regular full time employee of the company that “owned” the contract. My HR manager gave us a presentation about our reporting structure. I had at least seven managers for different reasons across various projects.
I got a new position so needed to resign but I had no idea which managers were the ones I should notify. I looked at the org chart that the HR lady showed. I sent my resignation to five managers that would be affected by my leaving. Unknown to me my project manager was actually a contracting manager hired by the client. He let his employer, the client, know that the lead dev quit.
Apparently it destabilized the contract for my employer. If I hadn’t just issued resignation they would have fired me for telling a customer about a significant internal staffing change. They didn’t fire me because the optics would have been worse for them.2 -
This was interview in so called startup.
BTW I don't get point in company calling themselves as startup when they are 5-6 years old, just call your self small sized company.
1 - online interview with HR, Normal.
2 - online technical interview - 1 hour of discussion with Lead.
3. On-fucking-site technical interview - ~1 hour of detailed technical discussions.
4. Coding task- submitted successfully
5. Zoom meeting to discuss on coding task - just told it was good and started discussion on their dead project which was unrelated to job position but I've worked with that kind of thing so it was fine.
6. Trial Day Onsite - Gave me to draw a fucking BPMN chart - fuck you motherfuckers - I knew it was waste of time.
Fuck this kind of Hiring process which takes >1.5 month.9 -
This was not exactly the worst work culture because the employees, it was because the upper level of the organization chart on the IT department.
I'm not quite sure how to translate the exact positions of that chart, but lets say that there is a General Manager, a couple of Area Managers (Infrastructure, Development), some Area Supervisors (2 or 3, by each area), and the grunts (that were us). Anyway, anything on the "Manager" was the source of all the toxicity on the department.
First and foremost, there was a lack of training for almost any employee. We were expected to know everything since day-1. Yes, the new employees had a (very) brief explanation about the technologies/languages were used, but they were expected to perform as a senior employee almost since the moment they cross the door. And forget about having some KT (Knowledge Transfer) sessions, they were none existent and if they existed, were only to solve a very immediate issue (now imagine what happened when someone quit*).
The general culture that they have to always say "yes" to the client/customer to almost anything without consulting to the development teams if that what was being asked to do was doable, or even feasible. And forget about doing a proper documentation about that change/development, as "that was needed yesterday and it needs to be done to be implemented tomorrow" (you know what I mean). This contributes to the previous point, as we didn't have enough time to train someone new because we had this absurd deadlines.
And because they cannot/wanted to say "NO", there were days when they came with an amount of new requirements that needed to be done and it didn't matter that we had other things to do. And the worst was that, until a couple of years (more or less), there was almost impossible to gather the correct requirements from the client/user, as they (managers) "had already" that requirement, and as they "know better" what the user wants, it was their vision what was being described on the requirements, not the users'...
And all that caused that, in a common basis, didn't have enough time to do all this stuff (mainly because the User Support) causing that we needed to do overtime, which almost always went unpaid (because a very ambiguous clause of the contract, and that we were "non-union workers"**). And this is my favorite point of this list, because, almost any overtime went unpaid, so basically we were expected to be working for free after the end of the work day (lets say, after the 17:00). Leaving "early" was almost a sin for the managers, as they always expected that we give more time to work that the indicated on the contract, and if not, they could raise a report to HR because the ambiguous clause allowed them to do it (among other childish things that they do).
Finally, the jewel of the crown, is that they never, but never acknowledge that they made a mistake. Never. That was impossible! If something failed on the things/systems/applications that they had assigned*** it was always our fault.
- "A report for the Finance Department is giving wrong information? It's the DBA's fault**** because although he manages that report, he couldn't imagine that I have an undocumented service (that runs before the creation the report) crashed because I modified a hidden and undocumented temporal table and forgot to update that service."
But, well, at least that's on the past. And although those aren't all the things that made that workplace so toxic, for me those were the most prominent ones.
-
* Well, here we I live it's very common to don't say anything about leaving the company until the very last day. Yes, I know that there are people that leave their "2-days notice", but it's not common (IMHO, of course). And yes, there are some of us that give a 1 or 2-weeks notice, but still it's not a common practice.
** I don't know how to translate this... We have a concept called "trusted employee", which is mainly used to describe any administrative employee, and that commonly is expected to give the 110% of what the contract says (unpaid overtimes, extra stuff to do, etc) and sadly it's an accepted condition (for whatever reasons). I chose "non-union workers" because in comparison with an union worker, we have less protections (besides the legal ways) regarding what I've described before. Curiously, there are also "operative workers", that doesn't belong to an union, but they have (sometimes) better protections that the administrative ones.
*** Yes, they were in charge of several systems, because they didn't trust us to handle/maintain them. And I'm sure that they still don't trust in their developers.
**** One of the managers, and the DBA are the only ones that handle some stuff (specially the one that involves "money"). The thing that allows to use the DBA as scapegoat is that such manager have more privileges and permissions than the DBA, as he was the previous DBA2 -
Oh boy, this is gonna be good:
TL;DR: Digital bailiffs are vulnerable as fuck
So, apparently some debt has come back haunting me, it's a somewhat hefty clai and for the average employee this means a lot, it means a lot to me as well but currently things are looking better so i can pay it jsut like that. However, and this is where it's gonna get good:
The Bailiff sent their first contact by mail, on my company address instead of my personal one (its's important since the debt is on a personal record, not company's) but okay, whatever. So they send me a copy of their court appeal, claiming that "according to our data, you are debtor of this debt". with a URL to their portal with a USERNAME and a PASSWORD in cleartext to the message.
Okay, i thought we were passed sending creds in plaintext to people and use tokenized URL's for initiating a login (siilar to email verification links) but okay! Let's pretend we're a dumbfuck average joe sweating already from the bailiff claims and sweating already by attempting to use the computer for something useful instead of just social media junk, vidya and porn.
So i click on the link (of course with noscript and network graph enabled and general security precautions) and UHOH, already a first red flag: The link redirects to a plain http site with NOT username and password: But other fields called OGM and dossiernumer AND it requires you to fill in your age???
Filling in the received username and password obviously does not work and when inspecting the page... oh boy!
This is a clusterfuck of javascript files that do horrible things, i'm no expert in frontend but nothing from the homebrewn stuff i inspect seems to be proper coding... Okay... Anyways, we keep pretending we're dumbasses and let's move on.
I ask for the seemingly "new" credentials and i receive new credentials again, no tokenized URL. okay.
Now Once i log in i get a horrible looking screen still made in the 90's or early 2000's which just contains: the claimaint, a pie chart in big red for amount unpaid, a box which allows you to write an - i suspect unsanitized - text block input field and... NO DATA! The bailiff STILL cannot show what the documents are as evidence for the claim!
Now we stop being the pretending dumbassery and inspect what's going on: A 'customer portal' that does not redirect to a secure webpage, credentials in plaintext and not even working, and the portal seems to have various calls to various domains i hardly seem to think they can be associated with bailiff operations, but more marketing and such... The portal does not show any of the - required by law - data supporting the claim, and it contains nothing in the user interface showing as such.
The portal is being developed by some company claiming to be "specialized in bailiff software" and oh boy oh boy..they're fucked because...
The GDPR requirements.. .they comply to none of them. And there is no way to request support nor to file a complaint nor to request access to the actual data. No DPO, no dedicated email addresses, nothing.
But this is really the ham: The amount on their portal as claimed debt is completely different from the one they came for today, for the sae benefactor! In Belgium, this is considered illegal and is reason enough to completely make the claim void. the siple reason is that it's unjust for the debtor to assess which amount he has to pay, and obviously bailiffs want to make the people pay the highest amount.
So, i sent the bailiff a business proposal to hire me as an expert to tackle these issues and even sent him a commercial bonus of a reduction of my consultancy fees with the amount of the bailiff claim! Not being sneery or angry, but a polite constructive proposal (which will be entirely to my benefit)
So, basically what i want to say is, when life gives you lemons, use your brain and start making lemonade, and with the rest create fertilizer and whatnot and sent it to the lemonthrower, and make him drink it and tell to you it was "yummy yummy i got my own lemons in my tummy"
So, instead of ranting and being angry and such... i simply sent an email to the bailiff, pointing out various issues (the ones6 -
Am I the only one seeing similarities between the price chart of silver and bitcoin?
Yes, display is crappy(school pc) 5
5 -
Dear Microsoft power bi team.
Go fuck yourself. Put that dashboard up your ass. The documentation for this is a joke.
The doc says I can get my tokens from azure portal. But guess what. The portal is a sea. And seems like powerbi is moved out from portal to its own powerbi.fuckyoumicrosoft.com
What the actual fuck you dimwits. Why don't you document it properly ?
For fuck sake. Go show up your analytics deep into your pie chart.2 -
Customer has asked me to recreate a dashboard they use with a bunch of data, charts, etc.
Problem: The screenshots they sent me... almost everything is illegible. The fidelity of the screenshots themselves is just fine.
It's that their dashboard they have is straight unintelligible. The charts are all smashed up, scale is off, most data ... you can't even tell what it is.
On one bar chart there's just one bar, no x or y scale indicators ... and a random dot in the bar... what even?
Apparently they love this dashboard but as far as I can tell they can't possibly be getting anything of value from it ...
It's like I can cook... but I can't make a recipe .. wrong ... just like someone else made it wrong from screenshots. :P -
So... ranters! Where are you from? Let's try to Make a chart with geographic distribution... what do you think?106
-
!rant
if you're someone who grades code, fuck you, you probably suck. Turned in a final project for this gis software construction class as a part of my master's degree (this class was fuck all easy, I had two weeks for each project, each of them took me two days). We had to pick the last project, so I submitted final project proposal that performs a two-sample KS test on some point data. Not complex, but it sounds fancy, project accepted. Easy money.
I write the thing and finish it, it works, but it doesn't have a visualization and that makes the results seem pretty lame, even though its fully functional. SO I GO OUT OF MY FUCKING WAY to add a matplotlib chart of the distribution. To do that, at the very bottom of the workflow, I define a function to chart it out because it made the code way more readable. Reminder, I didn't have to do this, it was extra work to make my code more functional.
Then, this motherfucker takes points off because I didn't define the function at the very beginning of the code... THE FUCK, DUDE? But, noobrants, it's "considered best prac--" nope, fuck you, okay? This class was so shit, not once was code style addressed in a lesson or put on any rubric - they didn't give a shit what it looked like - in fact, the whole class only used arcpy (and the csv mod once), they didn't teach us shit about anything except how to write geoprocessing scripts (in other words, how to read arcGIS docs about arcpy) and encouraged us to write in fucking pythonwin. And now, when the class is fucking over, you decide to just randomly toss this shit in, like it was a specific expectation this whole time? AND you do this when someone has gone out of their way to add functionality? Why punish someone who does extra work because that extra work isn't perfect? Literally, my grade would have been better without the visualization.
I'm not even mad at my grade - it was fine - I just hate inconsistency in grading practices and the random raising and lowering of expectations depending on how some grader's coffee tasted that morning. I also hate punishing people for doing more - it's this kind of shit that makes people A) wanna rip their eyeballs out, and B) never do anything more than the basic minimum expectation to avoid extra unwanted attention. If you want your coders to step up and actually put work in to make things the best they can be, yell at a grader to reward extra work and not punish it.4 -
12:55 AM, Subject gets and decides to look at crude oil chart.
1:05 AM, At it.
1:10 AM, Subject decides to check the temperature, using laptop screen in dark.
1:12 AM, Does a wild aerobic move to save flying laptop.
1:13 AM, Finds out that screen is gone.
1:23 AM, Orders new screen.
1:26 AM, Types this rant. -
A manager in the area, in an effort to “encourage” teams to meet their externally generated commitments before imposing mandatory extended hours, posted a chart showing Mt. Everest with weekly goals as stages up the mountain. First team to the top wins a $20 gift card. Looks just like this picture. Results will probably be similar.
 4
4 -
I'm a tech lead for a new agile project for a manager who knows nothing about agile. Having to work on a chart that shows exactly how many sprints each milestone will be and when it will complete for like, 17 sprints from now when requirements aren't even set. Wtf?7
-
I used to think our IT Support team is the most insufferable. I'm wrong and very sorry; if you guys are here to forgive me.
On the chart now is the security team.
The head of the security team doesn't simply understand that you can fucking not mix some programming languages in the same execution environment.
He is flipping making arguments on executing Javascript in a Java environment. He simply thinks Java is fucking Javascript. Yeah, I know you can make some drifts with GraalVM; sure not in our use-case.
Cross-Site Scripting has a fucking limit. You can't just pass any piece of code to mixed with a complied code and expect it to execute. Except if I'm wrong then I need someone here to show me how because he couldn't tell me how as he was just cynical in every damn way. moda sucker.4 -
Bloody mother fucking jesus christ....
It's working.
Sometimes I really wish I had the gift to be creative and to e.g. draw a (metaphoric) image of the shit I had to fix and how it felt to fix it.
It's sad not being able to share stuff in a way everyone can understand it :/
I uncludged the last bits of the networking / loadbalancer / craptastic network.
The whole chart that includes most of the associations / information for the network fits easily on a A2 paper. Internal only.
Just migration of a few remaining servers to Proxmox and a large MySQL to Postgres migration outstanding....
1.75 years and it's the first large milestone achieved. Large milestone as in it will not be a total clusterfuck anymore.
Still a lot of stuff to do...
But down to one major OS, Debian, for everything (container / VMs)... only LTS supported versions for services...
No more stuff that's so old it's near fossil state. We stillhad Ubuntu 12.04 running... :) ;) And XenServer is nearly gone...
Too many feels. Too many brain poofs. And way too much pain.1 -
Just in case any other devranters are in China, here is this morning's updated chart if you have wechat you can follow this account, stay safe and wash your hands
 5
5 -
Hey devs,
I'm really bad at personal project idea generation.
So, do you have any good Python project ideas?
PS. Wanna light up my github chart again.
(aaand to put it in my CV of course) 4
4 -
Stupid pipeline bullshit.
Yeah i get it, it speeds up development/deployment time, but debugging this shit with secret variables/generated config and only viewable inside kubernetes after everything has been entered into the helm charts through Key Vaults in the pipeline just to see the docker image fail with "no such file found" or similar errors...
This means, a new commit, a new commit message, waiting for the docker build and push to finish, waiting for the release pipeline to trigger, a new helm chart release, waiting for kubernetes deployment and taking a look at the logs...
And another error which shouldn't happen.
Docker, fixes "it runs on my machine"
Kubernetes, fixes "it runs on my docker image"
Helm, fixes "it runs in my kubernetes cluster"
Why is this stuff always so unnecessarily hard to debug?!
I sure hope the devs appreciate my struggle with this... well guess what, they won't.
Anyways, weekend is near and my last day in this company is only four months away.2 -
While I was exploring multiplication tables I stumbled on something cool.
Take any power of 2 on the multiplication chart.
Now look at the number in the bottom left adjacent box.
The difference of these two numbers will always be a Mersenne number.
Go ahead. Starting on the 2's column of a multiplication table, look in the bottom left of each power of 2 and get the difference.
2-2 = 0
4-3= 1
8-5 = 3
16-9=7
32-17=15
etc.
While the online journal of integer sequences lists a lot of forumlas, I just wrote what came to mind (I'm sure its already known):
((2**i)-(((2**i)/2)+1))
The interesting thing about this is it generates not only the Mersenne numbers, but if you run i *backwards* it generates *additional* numbers.
So its a superset of mersenne numbers.
at i = 0 we get -0.5
i=-1 -> -0.75
i=-2 -> -0.875
i=-3 -> -0.9375
i=-4 -> -0.96875
And while this sequence is *not* mersenne numbers, mersenne numbers *are* in this set.
Just a curious discovery is all.10 -
Anyone draw out the logic of a process by hand before coding much?
I've been doing that more and more, and it's handy but ... it's also kinda tedious making them on paper or even just in the VS Code extensions I've tried.
I'd really like a way to bust out quick flow charts in VSCode and there's a Draw.io add on and it's ok but lotta fidgeting with flow chats and dragging stuff.
It doesn't have to be pretty and it doesn't have to be super feature rich.... just want to quick bust out a series of steps flow chart style or ... hell any way fast and visual like.
Anyone use anything they really like?11 -
I was just wondering why the flying fuck OxyPlot was rendering an unknown node on my chart for monday when I only queued my sql db for a single Tuesday.
Noticed it was an auto generated node, which had the right time, status, everything.
I looked up my code and found out that the date somehow bugged out, and if c# isn't sure what to do with an empty date it initializes a date on 1.1.0001
And what do you know. Appearantly thats a Monday.
I broke my head way harder over this than I should have, assuming the worst possible bugs in the render engine. fml -
What web charting lib are you using ?
I tried canvasjs, chartjs, google chart..
And for the moment i love Echart, not too verbose -
Working on an app to sync data between our ticketing system and an API a vendor made for us to interact with their ticketing system. I put off working on it for months, mostly because I had mountains of other "urgent" things that jumped in my face, but also because I needed to design the whole thing, and I really have to get into the right frame of mind for that kind of creative organization.
Today I dove into it. I built the JSON to submit, given whatever variables are necessary, and figured out after a while that the smartest way to handle this is not to search for an existing internal ticket, but to have the creation of the internal ticket set a flag for an automated sync process to check when it runs.
It's going to be much easier when I get that built, but now, knowing that, I'm daunted enough that I'm procrastinating. Think of something, chart it out with notes in a text editor, procrastinate.That is probably like 95% of the time I spend in "development." -
You should know you can write error codes in hexspeak. Here is a color chart for eyecatching illustrative purposes.
 2
2 -
C# is getting so fucking obfuscated with these null check inceptions. Found the following in my company's code base. Why did it take me and 3 other devs an hour to figure out how to write this if statement into a flowchart?
if(!string.IsNullOrEmpty(a?.Id ?? b[0]?.Id))...😫😫😫
FYI: We figured it and also found some bugs with logic, but can you? I'll post our flowchart if ranters are interested.
So to add to the madness:
if(!string.IsNullOrEmpty(a?.Id ?? (b?.Any() ? b[0].Id : null)))...🤯🤯🤯23 -
New job is turning out to be kind of the opposite of what I was expecting, based on interviews.
I thought I had done a pretty thorough job asking the kinds of challenging and specific questions during the interviews and was pretty satisfied with the answers.
Three weeks in, I’ve more or less been turned loose onto my first project which is….installing patch updates.
Next few projects through the end of the year and into Q1 next year are similarly sysadmin-chore work, which I’m not going to act like is beneath me or unimportant but it’s not quite what we talked about in the interview when I applied to an SDET position.
Point of order to talk about once I wrap up these first few projects, it doesn’t exactly seem like they know where I’m supposed to be or where to even really put me (on the org chart I have a line reporting up to boss, but I’m also the only one not on a functional team) and reading through the wiki last guy just kind of did everything.
If that’s what this is….eh I need to know if that’s how they want to use me and find out soon.11 -
The devRant October 11 news update is amazing. devRant continues to grow and becomes more fun and informative every day. The upcoming story feature is valuable in my opinion. The podcasts are off the chart.
The new products are great - just ordered my sweatshirt.
You guys are working hard and the community appreciates it.
https://www.devrant.io/news?n=4 -
So I’m in a bit of a pickle.
I’ve become involved with a pretty fast paced group project. We’ve got 9 weeks to write up a mock PDR and all of the communication is done through Discord and teleconferences. As of last week an issue came up where one of the teammates (Black) felt accused by Red of being called authoritative and feels disrespected by the following message: “I don't know if I'm picking up on it correctly, but it feels like you want to control every situation. I feel like you're trying to take on a part of everyone's role so that you also need more people a part of each sub category. I think whatever happened is done whether we did turn it in late or not, I don't think we need to pressure others to do more that is needed. Also, Project Manager's dad passed. Not to make it an excuse, but I think it should be taken into consideration. Also, we didn't even verify all the positions til the meeting we had. So even still, we would have had to turn it in late since there were so many arrangements
If you don't trust your other members to do their job without having to be supervised, it can be counterintuitive to the whole teamwork aspect.” This message was sent after we missed a deadline to submit a team organization chart and Black team member insisted on becoming a third Assistant Project manager while making it seem as the other 2 APM’s were incompetent at their job.
Although I agree that it is difficult to communicate all of your emotions through written messages, I still think that taking your tone into consideration is crucial when working remotely. Am I wrong? Is there a better way to work with this team member? It’s still very early on in the project and this is the first time I’m working on a project with others with very little face to face communication. Typically when similar issues became present in other group projects, we would all sit down and discuss it and try to reach an agreement (or at least an understanding of where everyone is come from). Any advice is seriously appreciated. 13
13 -
>be me
>watching Clone Hero video
>streamer mentions something about HTML color tags being in a chart's metadata that's displayed properly
>...
>...
>...
>you WHAT
>really
>aight, let's test the clear security hole
*makes 1 note long chart and adds JS to metadata*
*metadata payload triggers when you attempt to play the chart*
FUCKING...
this is dumb.6 -
git commit -m "Now we have a not a true scatter scatter chart"
I mean, what's the worst that can happen, my commits are very informative. -
Just finished making an ER diagram for the 5th time now.
It was less painful this time. (Thanks draw.io)
(About the 4th ER diagram - le professor says "It looks like a flow chart, that's not right", but it's clearly not?)
I'll have to submit the draft tomorrow to the professor, I just hope that he green lights it so I could finalize the project report.
I hate making ER diagrams now. -
Asked prof for LORs for grad school application. Once he submitted 6 lors, I sent him a chart in email stating what schools are done, what are pending. STUPID MOTHERFUCKER refused to give me any more LORs because he suddenly thinks I've become un-recommendable due to sending him an email. These EGOISTIC BASTARDs will die of hunger if they are to survive in the industry. They are surviving on govt money, MY TAX MONEY, but still refuse to give LORs for absolutely stupid reasons. Does someone know a hitman ? I want to kill this PIECE OF SHIT.7
-
Data wrangling is messy
I'm doing the vegetation maps for the game today, maybe rivers if it all goes smoothly.
I could probably do it by hand, but theres something like 60-70 ecoregions to chart,
each with their own species, both fauna and flora. And each has an elevation range its
found at in real life, so I want to use the heightmap to dictate that. Who has time for that? It's a lot of manual work.
And the night prior I'm thinking "oh this will be easy."
yeah, no.
(Also why does Devrant have to mangle my line breaks? -_-)
Laid out the requirements, how I could go about it, and the more I look the more involved
it gets.
So what I think I'll do is automate it. I already automated some of the map extraction, so
I don't see why I shouldn't just go the distance.
Also it means, later on, when I have access to better, higher resolution geographic data, updating it will be a smoother process. And even though I'm only interested in flora at the moment, theres no reason I can't reuse the same system to extract fauna information.
Of course in-game design there are some things you'll want to fudge. When the players are exploring outside the rockies in a mountainous area, maybe I still want to spawn the occasional mountain lion as a mid-tier enemy, even though our survivor might be outside the cats natural habitat. This could even be the prelude to a task you have to do, go take care of a dangerous
creature outside its normal hunting range. And who knows why it is there? Wild fire? Hunted by something *more* dangerous? Poaching? Maybe a nuke plant exploded and drove all the wildlife from an adjoining region?
who knows.
Having the extraction mostly automated goes a long way to updating those lists down the road.
But for now, flora.
For deciding plants and other features of the terrain what I can do is:
* rewrite pixeltile to take file names as input,
* along with a series of colors as a key (which are put into a SET to check each pixel against)
* input each region, one at a time, as the key, and the heightmap as the source image
* output only the region in the heightmap that corresponds to the ecoregion in the key.
* write a function to extract the palette from the outputted heightmap. (is this really needed?)
* arrange colors on the bottom or side of the image by hand, along with (in text) the elevation in feet for reference.
For automating this entire process I can go one step further:
* Do this entire process with the key colors I already snagged by hand, outputting region IDs as the file names.
* setup selenium
* selenium opens a link related to each elevation-map of a specific biome, and saves the text links
(so I dont have to hand-open them)
* I'll save the species and text by hand (assuming elevation data isn't listed)
* once I have a list of species and other details, to save them to csv, or json, or another format
* I save the list of species as csv or json or another format.
* then selenium opens this list, opens wikipedia for each, one at a time, and searches the text for elevation
* selenium saves out the species name (or an "unknown") for the species, and elevation, to a text file, along with the biome ID, and maybe the elevation code (from the heightmap) as a number or a color (probably a number, simplifies changing the heightmap later on)
Having done all this, I can start to assign species types, specific world tiles. The outputs for each region act as reference.
The only problem with the existing biome map (you can see it below, its ugly) is that it has a lot of "inbetween" colors. Theres a few things I can do here. I can treat those as a "mixing" between regions, dictating the chance of one biome's plants or the other's spawning. This seems a little complicated and dependent on a scraped together standard rather than actual data. So I'm thinking instead what I'll do is I'll implement biome transitions in code, which makes more sense, and decouples it from relying on the underlaying data. also prevents species and terrain from generating in say, towns on the borders of region, where certain plants or terrain features would be unnatural. Part of what makes an ecoregion unique is that geography has lead to relative isolation and evolutionary development of each region (usually thanks to mountains, rivers, and large impassible expanses like deserts).
Maybe I'll stuff it all into a giant bson file or maybe sqlite. Don't know yet.
As an entry level programmer I may not know what I'm doing, and I may be supposed to be looking for a job, but that won't stop me from procrastinating.
Data wrangling is fun. 1
1 -
!rant
Golang Backend + Supabase = ❤️
I feel like a freaking 🧙♂️ built a real-time chart in an hour!3 -
Yeah today i'm sharing a little java program who can scan any editable file in your system and count all the alphabet character from it and show the result in a chart renderer in an html document
Code
https://github.com/Afrographic/... 11
11 -
I was in college till April. And joined a job midway through May!
Now I work only on weekdays! And the gap in the middle is the exam week!
-
The first computer I used as a youngster was an iMac G3. We made flow charts and it was magical. I used any excuse possible to get on the computer and make a flow chart.
-
When your computer science teacher asks to write the psedo code and flow chart first, instead of just coding the program. That frustration!!!!9
-
The scrum master cries out for the team’s burndown chart as he move more unplanned work into the current Sprint.1
-
“so i know you folks are up against it with this deadline, but i made a burndown chart i’d like to go through” - every project manager
-
Every once in a while I'm the stupid one at work. Was wondering why my Google Chart tooltips flickered on hover. Found some bug and a workaround on SO but it kept happening. Then I noticed the container div kept refreshing and I couldn't explain why. Until I commented all my code and by systematically enabling it line by line I noticed my dumb ass used setInterval instead of setTimeout. Well yes if you keep redrawing the chart it is going to flicker! *facepalm*
-
Fuck companies that want you to build new systems that are a superset of what they already have when they can't even tell you what they have now. Fuck you with your bullshit, nonsensical, self-contradicting, third-assed diagrams--some half-UML, half-clip-art, half-pie-chart drivel. If you're the CTO of a company and you want me to think long and hard about rebuilding your distributed systems, you can think long and hard about expressing what you already have. And NO: a verbal explanation pow-pow WebEx over your DSL connection with your protege that mumbles worse than an Atlantan rapper doesn't count as fucking "knowledge transfer" of your fucking architecture, FOR FUCKS SAKE.
-
Hey everyone :-) - Hope you're all doing well & Staying safe, i just have a question for you all, i have a project i am working on which is a command line tool to track my storage on my PC & laptop, right now it outputs my remaining space, used space and storage capacity :-), it also shows these numbers on bar chart & pie chart - i'm proud of it! :D , its written in Python also - would love to know what other things would you guys add to it? any ideas? id really appreciate it :-) cheers! <336
-
Our burndown chart went upwards this sprint. I'm sorry, I meant our burnup chart. It was an unforgettable sprint indeed.3
-
Pareto Chart Widget is my little contribuition for the WHMCS community =)
https://github.com/khigashi/...
-
Just tried to save an image of a chart from a websi--NOPE it's not an image! It's actually an array of numbers in a series of special fonts with a small background image behind it all. Why in gods name would you do this? You went through the trouble of adding the background image, why wouldn't you just combine the actual chart into it?8
-
I had a problem visualizing giant job/schedule dependencies trees a few years ago and basically wrote a program to convert the dependencies so it could be read in by a JS graph program that actually did the work. The output was a Gantt chart but really messed up, overlapping arrows, not very readable.
Today someone asked me for my app and but in a better format/visualization.
I so I was thinking how do I do this... Figure out which nodes are leaves, how to combine visually.
Programmatically you just link all the Nodes together. So I was thinking like how u need to use BFS and Mark when each more is traverse and on its first traversal, add it to a Map<Depth,List<Node>> then print each level, etc.
But not so straight forward.... But finally realized that I'm not trying to draw a Tree (or a tree where the rootams are actually in the middle and the top n bottom are leaves)... But actually a Graph.... A DAG....
SO FINALLY I googled and found GraphViz...
https://graphviz.gitlab.io/gallery/
And in the gallery I opened some pictures and printed at the bottom was like 1996...
And I'm now wondering "how the fuck did they do this?" Calculate where all the vertices should be placed so they can be linked with lines and and not look like a big mess...I guess like a yarnball 4
4 -
!rant (I got down voted for this on Stack Overflow, so I try to discuss the issue with a more professional crowd.)
In a Software Engineering class, we had an assignment to read Parnas' seminal paper on modularization [0]. In this paper, two approaches of dividing a software into modules are discussed:
Traditional Approach: A flow chart is drawn to work out the single processing steps and the program's high-level flow. Then every processing step is turned into a module. This approach doesn't yield very good results.
New Approach: Every design decision will be turned into a module by the means of information hiding. This approach leads to much better results.
My personal interpretation of the term design decision is that the modules are identified as data structures rather than as processing steps of an algorithm. This makes sense, because data structures are much more suitable for information hiding then processing steps of an algorithm. (The information inside a data structure is hidden behind functions, whereas a function only hides more detailed processing steps and no information; the information is actually passed in as arguments.)
Why does the second approach work so much better than the first approach? Here comes my second interpretation: The single processing steps of an algorithm are not replaceable (and thus not reusable), whereas it's possible to convert data structures into other data structures.
And here's my question: Could that be the reason why software development using workflow engines (based on BPMN, for example) never really took off?
My personal experience is that the activities created in such workflows are hardly ever reused, but there often are big data structures passed around all the involved activities, even if most of the activities use only one or two of them.
My question exaggerated: Could we get rid of all those clumsy workflow engines by giving managers Parnas' paper to read?
[0]: On the criteria to be used in decomposing systems into modules (Parnas 1972)2 -
Finally finished my macOS+iOS project.
Mac app which play your YouTube playlist while displaying changeable image next to the player with the workout you are doing. It has features like:
-saving workout details in calendar
-download the currently playing video
-remove song from current playlist and add it to playlist with Old songs
-save the remaining songs of the playlist shuffled to new playlist to listen to them from your phone while you take a bath after the workout for example
-the app detects three playlists based on the description:
*”music” in description for Music playlist
*”newest old” in description for Old songs playlist
*”rest songs” in description for rest songs playlist(the songs you didn’t listened to from music playlist, this playlist is auto generated on exit if you want)
-the app can play any playlist or video from YouTube sent by the iOS app over tcp and add a song to your Music playlist if you liked it.
The iOS app features:
-gesture control for the main app over TCP
-chart for the weekly calorie burn retrieved from calendar.
View images: http://imgur.com/a/likbS
-
Has anyone experience with technical chart analyses? The only method I found useful so far is the moving average.
I'm trying to create a trading bot and he is already fetching data each minute. Now (after a few days) the time has come to create some kind of algorithm to decide when to buy/sell.6 -
Maybe you people will like this story.
The past semester I studied Java in class. First time doing object oriented programming, I had an annoying teacher but got the hang of it. I still miss C from the last year.
As a final project we had to do any program and apply some stuff we saw in class (The program should have an array list, use interfaces, bla bla bla bery simple stuff). It also must have a complete documentation, a manual and a diary explaining what was developed every week. Bonus points if it was in a repository like GitLab.
I wanted to do an RPG game in a matrix, like a rougelike or an old FF game, that should be a map or two, a few monsters and items and that's it. Enough to show what can I do and to have enough excuses to apply everything that the teacher asked. I had a team with two friends who wanted to do the same.
After making accounts in three different pages that apparently would help us to be more organized (One to make charts and two task trackers) I lost all patience and made an account in GitLab, made the basic classes that we had defined in a chart, divided the tasks and put them in to do on GitLab and we started to work.
One of my companions caused a lot of problems. First, he didin't wanted to learn how to use GitLab (I simply asked them to do merge requests) and he insisted to use GitHub. Then he started to say that using the console version was even better (Pretty sure he said thet he never used Git, but maybe was gas poisoning). The GitLab repository never had a single commit to his name.
BUT WAIT IT GETS BETTER all the entire time, he was complaining about the graphical interface of the game, wanting to use some SDK for RPGs that he found. I told him that we will see that at the end, that first we should have all the mechanics done, test it in ASCII in the console and then, if we have time, we will put the visual interface, separated and optional from the main program to avoid problems.
After two weeks where he gave me very simple standard stuff late, half done and through Google Drive, I discovered he was most of the time working on... the graphical interface SDK! He took the job already done by me and the other guy and making a pretty hardcoded integration with the graphical interface and making everything that he tought it would be necesary. Soon enough the GitLab repository was totally outdated and completly useless. He had the totallity of the project in his half broken laptop, and sometimes he gave us a zip with all the code, outdated after a few minutes. Most of the stuff that I made was modified, a lot of the code was totally unknown to what it was and I had no idea even of how the folders were organised.
We had a month to finish it. I got totally disconected from the project and just hoped for the best, sometimes doing a handful of generic and adaptable lines of code for a specific thing (Funny enough, many core mechanics were nonexistent). The other guy managed to work more on the project, mostly fixing the mess that the guy did: apparently he didin't read the documentation of the SDK and just experimented and saw tutorials and tried to figure out how to do what he wanted.
Talking about documentation: we dont had yet. The code wasn't even commented propely. We did all that the last week and some stuff was finished the last night. The program apparently worked but I had no idea.
Thank God, the teacher just looked over everything and was very impressed by the working camera and the FF tiles. I don't think he saw the code or read too much of the documentation, much less when I directly wrote how I lost all access to the project.
I had a 10/10. I didin't complained. Most easy and annoying ten I ever had. I will never do a project with that guy. -
[ WEBDEV frontend QUESTION ]
I will need to build a new admin dashboard for representing a lot of data from the api. the API is written in PHP and this won't change. We are currently using jquery to make the data interactive (choose date ranges, different filters and so on). Were currently using morris.js for charts. I'm thinking this would be a good opportunity to learn and use a new js framework to make the data more easily bindable on buttons and selects (not so many listeners on buttons and shit like that).I will be developing the front end on my own, alone, so i mostly have freedom here. I need something that has implementations of chart rendering, and which I could learn in a week or two in the evenings after work (starting to work on this in the next week probably). What are your guys recommendation? Whats the best option for dashboards js wise? I was thinking vue, won't I shoot myself in the foot for using a new technology(for me anyway) right from the bat?2 -
Started with flow chart programming in a robotics club after class in middle school.
Joined another club where I spent the first 3-4 weeks learning Python and JS basics on freecodecamp.
Programming classes on algorithms and frameworks in high school and college.
Beyond that, mostly reading documentation, stackoverflow and some udemy courses. -
I've a whole new respect for ElasticSearch. It's codebase is so insanely complex, that I'm seriously contemplating tracing out the flow on a big ass chart. Any suggestions on how you people work and debug so many asynchronous flows?
I have been working on a bug, for almost 6 days (to be read as 3 consecutive weekends), and the best I've done is, conceptually isolate where it's happening. I'm an open source noob, but I feel I've learnt a whole lot during sifting through ES' codebase. :)2 -
Again idiotic language or documentation.
I want to just draw stupid arrow on chart. Took code from example. It just does not draw. No fucking error.
mql language.
Just in case somebody knows:
ObjectCreate(name, OBJ_TEXT, 0, 0, 0, 0, 0);
ObjectSetText(name, name);
ObjectSet(name, OBJPROP_COLOR, Green);
//ObjectSet(name, OBJPROP_TIME1, Time[0]+2*Period()*60);
ObjectSet(name, OBJPROP_TIME1, Time[0]);
ObjectSet(name, OBJPROP_PRICE1, High[0]);
this code is in onTick() method.
It looks like there are tons of posts on how to do it but nothing works what I have tested.
I really from time to time think about writing some trading bot but probably thats why I stop doing it because it takes so much time to do simple things with this language.
I could do with languages which I know - php, js , but still if i want to run it with brokers who have metatrader, I would need to know mql language :(3 -
Just gonna leave this here:
https://github.com/FireFox2000000/...
Like who the fuck puts releases in their own git repo? Apparently this guy.1 -
Only half dev-related but AAAAARRRGGGGHH it sure as hell is a rant.
Doing a programming course, and I'm supposed to provide flowcharts of the code. I just spent over TWO FUCKING HOURS working on one in LibreOffice Writer, saving in between to make sure it didn't mess up. But of-FUCKING-course as soon as I do the final goddamn save for the chart, it just magically disappears. My hate for word editors burns with the intensity of all the fires of hell, and almost even rivals my hate for M$...2 -
Have to translate an API library from Ruby into PHP for work, and I swear it's all of the worst pieces of BASIC and Swift thrown together. To top it off, looking up a symbol chart for it to try and get a handle on the symbols they love to throw in front of variable and method names is useless because "symbol" is a freaking type in this language! Arrays are apparently called "hashes" now, and I can't quite tell if modules are supposed to be namespaces or classes yet...
If Ruby has redeeming qualities, I'm definitely open to hearing them. Right now I'm kind of feeling homesick for vanilla C, however...1 -
we have been working... we swear...
this is right at the end of a project which was artificially extended because the review process wasn't setup in time. we've had to do certain things the product owners way, whilst shaking our heads and this useful chart is one of the side effects. sidenote, product owner is looking at this chart and showing it to higher ups, trying to show progress being made... i give up.
-
Hey guys, need a lil help from any front-ender, I need to create a chart that allows me to show tooltips for specific timeframes and let's me click them and go to the specific url for that timeframe, I know this isn't SO but from my past experiences, I would rather ask here. I have looked at chart.js and other libraries but I'm not sure If chart.js has those capabilities.
I would like to achieve something like this : https://treo.sh/demo/1/...
Any tips are welcomed :)9 -
Terraform + helm-chart ... I really ned a break. Who the fuck invented this shit.
The HCL format sucks
The documentation sucks
The dev tools suck
The debug output sucks
But I'm ok with that, I can manage.
But today really it shot the bird ... I can't have a fucking comma in a string? Because idk why the fuck helm-release tries to parse that fucking string and wants to make an array or whatever out of it? Why, you fucking abomination?
Something in the docs? Nah, who reads them anyway.
Because you know it's totally not strange that a string is analyse and oh wait there's a comma in it, the dev surely wants me to make an array out of it, because you know ...
So now I have to escape my fucking comma to prevent it to parse my fucking string. I just want to have a fucking string you hideous monstrosity ....1 -
Hey guys! hope everyone is doing very well this week! and as always i really hope everyone has an amazing week ahead!, i would like to ask a question i am soooo stuck in my project and i need help!, so i have a line chart in my project... the graph shows but the lines do not?, i'm using angular and ionic!, i'm also receiving no errors in my console! :-(
i would love some input from you guys <3 would really mean alot!, thank you once again for taking the time to read my question!
kind regards Milo :-)3 -
Good evening, night, morning or day...
does someone knows a nice angular 5, typescript module to use for generating candlestick charts?
Merci! -
are Helm charts supposed to be extended somehow by declaring them as the "base" in a new Helm chart? I'm trying to find documentation about how to refer a chart at https://artifacthub.io/ as base in a fresh Helm chart to overwrite the default values in the fresh values.yaml1
-
I want to dive into Flutter and need a simple app idea that I can start with. I want to learn while working on a useful project. Any suggestions?
PS: I built a calculator and a simple chart app few weeks ago and loved flutter. -
Is there some sort of Query Builder for ElasticSearch?
I have ELK setup and in Kibana can generate all the aggregation visualizations but now I want the data to be usable in a program so it can generate reports like who are our top users.
But the aggregation queries seem to be very verbose... not sure how anyone can generate or understand it by hand vs telling Kibana I want a chart with X and Y axes using these terms.
IDeally I'd like to have Kibana then tell me what's the actual JSON/Elastic query it used to generate that but can't seem to find something like that.1 -
First chart library:
Perfect, but when you hide it, change tabs, come back and show them they freaking explode. Stupid bug, not ideal, I don't have time for this, move on.
Second chart library:
Cool, cute, but why doesn't it update? Wait, why did this one disappear? Why doesn't it ever appear again? Wtf? It's just like the others...
Do I really have to make my own chart library?1 -
Somewhere in out application backend we generate a simple bullet chart. But in the most complicated way possible.
We call a web service to retrieve it(yes, a simple bullet chart). The service requires some parameters, and the code that generates them is hidden behind a wall of interfaces and abstract methods (the best and apparently only way to get to the actual code is to debug it).
However, one of these parameters is very well visible and it is a string with (uncommented)javascript function that manipulates the resulting chart, adding some final touches. With hardcoded values etc..
Dear programmers, I know we should avoid reinventing the wheel, but sometimes we should stop and consider the possibility, that we are using the wrong wheel and in completely wrong/obscure way. Thank you.
Yours WhoeverWillMaintainTheCode3 -
Something as simple as changing the color on a pie chart in visual studio frustrates me!!!!!!
why cant it be as simple as color = color.black!!!!4 -
gah. when I say I like doing documentation, I don't mean gantt chart, test cases, status update, rollout plans and newsletters
-
You gotta love the actual useful stuff from XKCD.
Sometimes they apply extreme seriousness to some really unimportant stuff, like the tik-tak-toe cheat sheet.
At other opportunities, they hide some jokes completely serious looking stuff, like in 1688 the map identification chart. -
So... According to this chart devs should not listen to heavy metal and punk...
https://columnfivemedia.com/work-it...2 -
is there a tool I can use to render a candle chart (like those use in trading) but with code? like PlantUML but allowing to render candle charts4


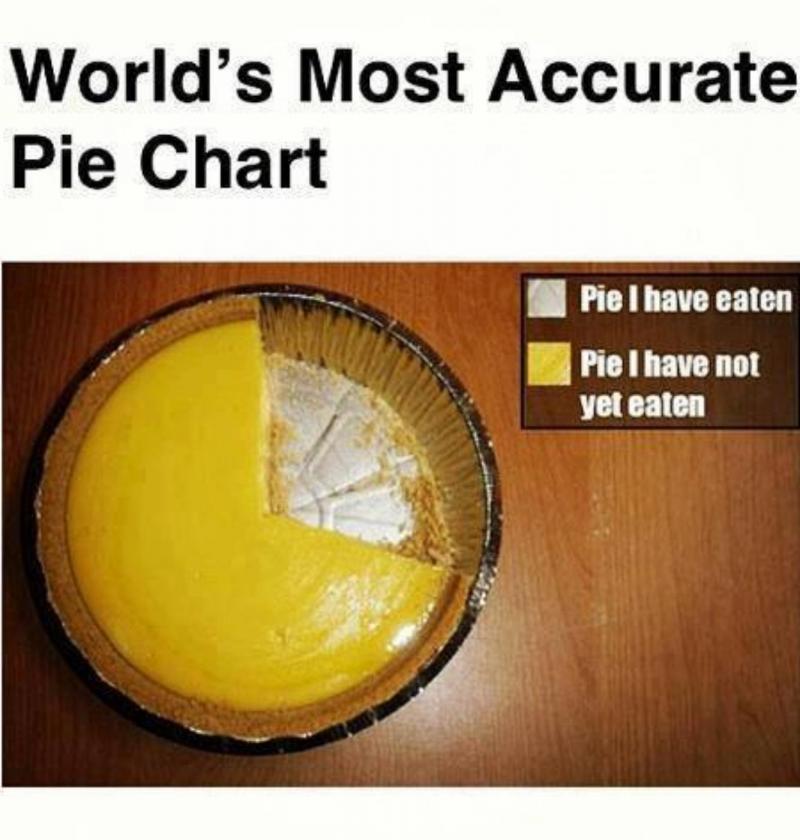


Top Tags
Weekly Rant
View